Results

Two questions, the same held-out decisions

The direct comparison of the predictive approaches comes first. Every number is read from the exported result files. The held-out LLM (Qwen3-8B-Base) evaluation has not been run yet and is not part of these tables; seven demo positions scored locally appear on the home page only.
Provenance: Experimental finding. Measured on the held-out test split of our controlled decision-level substitution benchmark.
Task 1: for each of 12,863 original, presumed-human decisions in the held-out test split (321 source games, 605 player-games), how much probability does each model give to the move the human actually played? No synthetic variants; no model was fitted or tuned on these data.

The general-purpose LLM (Qwen3-8B-Base) is the next experiment: its scorer and analysis are built, but it has not been run on the held-out data, so it is not part of these tables yet. Nothing has been estimated in its place.

Findings (generated from the result files)

Finding
Maia-3 79M predicted engine-first-move choices better than the Regan-inspired reconstruction (log-loss for predicting whether the engine's first move is played).
Evidence.
0.588 vs 0.422; paired difference −0.165 [-0.178, -0.152] (paired source-game bootstrap, 95%).
Interpretation.
Measured on original, presumed-human decisions of the held-out test split; the models were frozen and not tuned on these data.
Limitation.
Source games are presumed human; one month of Lichess rapid/classical games; no multiplicity correction.
Finding
Maia-3 79M predicted original human moves better than Maia-3 5M (top-1 accuracy).
Evidence.
55.5% vs 56.9%; paired difference +0.014 [0.008, 0.019] (paired source-game bootstrap, 95%).
Interpretation.
Measured on original, presumed-human decisions of the held-out test split; the models were frozen and not tuned on these data.
Limitation.
Source games are presumed human; one month of Lichess rapid/classical games; no multiplicity correction.
MetricRegan-inspiredMaia-3 79MMaia-3 5M (secondary)
Top-1 move accuracyhigher is betternot defined56.9%[56.0%, 57.9%]55.5%[54.5%, 56.5%]
Top-3 move accuracyhigher is betternot defined84.4%[83.6%, 85.1%]82.5%[81.7%, 83.2%]
Mean negative log-likelihood (nats)lower is betternot defined1.280[1.251, 1.309]1.350[1.320, 1.379]
Brier score (multi-class)lower is betternot defined0.559[0.549, 0.569]0.579[0.569, 0.589]
Mean rank of the played movelower is betternot defined2.23[2.18, 2.29]2.37[2.31, 2.43]
Median rank (descriptive)lower is betternot defined11
Engine-first-move event: log-losslower is better0.588[0.580, 0.597]0.422[0.409, 0.437]0.441[0.427, 0.457]
Engine-first-move event: Brierlower is better0.201[0.197, 0.205]0.135[0.131, 0.140]0.141[0.136, 0.146]
Engine-top-3 event: log-losslower is better0.593[0.584, 0.601]0.423[0.413, 0.432]0.441[0.431, 0.450]

95% intervals: source-game cluster bootstrap (2000 resamples). “Not defined”: the Regan-inspired reconstruction does not output a probability for every legal move, so move-level metrics cannot be computed for it; it is compared on the engine-first-move and engine-top-3 events, which all three models predict.

Which metrics are defined for which approach

OutputRegan-inspiredMaia
Probability for every legal move
Top-1 / top-3 move prediction
Negative log-likelihood of the played move
Multi-class Brier score
Rank of the played move
P(played move = engine's first line) — T1 event
P(played move in engine's top 3) — T3 event
Game-level assistance-sensitive score

Paired differences (Task 1)

Difference = second − first, same bootstrap resamples for both (paired). Multiple comparisons; no multiplicity correction.

ComparisonMetricDifference [paired 95% CI]Reading
Maia-3 5M → Maia-3 79Mtop1 accuracy+0.0139 [0.0083, 0.0193]favours Maia-3 79M
Maia-3 5M → Maia-3 79Mtop3 accuracy+0.0190 [0.0153, 0.0228]favours Maia-3 79M
Maia-3 5M → Maia-3 79Mmean nll−0.0703 [-0.0777, -0.0629]favours Maia-3 79M
Maia-3 5M → Maia-3 79Mbrier multiclass−0.0199 [-0.0229, -0.0170]favours Maia-3 79M
Maia-3 5M → Maia-3 79Mmean rank−0.1334 [-0.1531, -0.1122]favours Maia-3 79M
Regan-inspired → Maia-3 79Mt1 event logloss−0.1654 [-0.1777, -0.1523]favours Maia-3 79M
Regan-inspired → Maia-3 79Mt1 event brier−0.0655 [-0.0699, -0.0612]favours Maia-3 79M
Regan-inspired → Maia-3 79Mt3 event logloss−0.1701 [-0.1802, -0.1593]favours Maia-3 79M
Regan-inspired → Maia-3 79Mt3 event brier−0.0651 [-0.0693, -0.0609]favours Maia-3 79M
  • · Source games are presumed human; their absence of real assistance is not established.
  • · Substitutions are controlled decision-level substitutions evaluated in the original positions; games are not replayed.
  • · Bootstrap resamples source games with the fitted/frozen models held fixed; refit variability is not captured.
  • · Several comparisons are reported; no multiplicity correction is applied.
  • · The Regan-inspired reconstruction is not Professor Regan's analyzer and outputs no per-move distribution.
Hybrid extension · secondary

Can the Signals Be Combined?

The direct comparison tests individual predictive approaches. The existing hybrid experiment asks whether combining Stockfish, Maia, sequence/context and statistical features in nested systems A → B → C → D improves the controlled benchmark. These results are unchanged from the validated experiment.

We begin with presumed-human source games and make controlled decision-level substitutions, giving us known intervention labels without accusing real players.

Evaluated in the original positions.

Learn more about the benchmark
  • Source: Lichess rated rapid/classical games, one game per player. They are presumed human; that they contain no real assistance is not established.
  • At chosen decisions, an engine move is substituted and evaluated in the original position. Later positions stay those of the original game; these are not replayed assisted games.
  • Three strategies (Random, Selective in the hardest positions, Subtle near-best moves) at nominal levels of 5–70% of eligible decisions. Substitutes come from the same engine used for analysis, which makes heavy substitution easier to detect than real assistance might be.
  • Held-out test split: 321 source games → 605 original player-games → 9,075 substituted variants. Variants of one game are not independent, so every interval resamples whole source games. Test players never appear in training.
  • The statistical baseline (A) is our Regan-inspired approximation. Regan's analyzer was not run or compared here.

Four nested systems, one held-out test set

Each system adds one source of evidence to the previous one. Select a step.

What was added
Maia-3 predicted probability, rank and surprisal of each chosen move, and how often engine-best choices differ from Maia-3's most probable move.
Why it was added
The central question: does a learned estimate of what similarly rated humans play add information beyond move strength?
Measured change
+0.047 ROC-AUC versus B (0.826 → 0.873)
Uncertainty
Paired 95% CI +0.040 to +0.054, which excludes 0. Resamples whole test source games (2,000 resamples, the same for both systems).
Provenance: Experimental finding. Measured on the held-out test split of our controlled decision-level substitution benchmark.The key finding

In this controlled benchmark, adding the learned human-move model produced the largest incremental AUC increase.

B → C (+ Maia-3): +0.047 ROC-AUC · paired 95% CI +0.040 to +0.054

Change in ROC-AUC at each step
A → B+0.007
B → C+0.047
C → D+0.007
0+0.02+0.04

Bar = paired difference · whisker = paired 95% CI

Paired bootstrap change in ROC-AUC for each incremental step
StepChange95% CI low95% CI high
A to B+0.007+0.003+0.010
B to C+0.047+0.040+0.054
C to D+0.007+0.002+0.011

Caveat. These seven paired comparisons use no multiplicity correction, and the bootstrap conditions on the fitted models rather than accounting for variation from refitting them. The benchmark is synthetic; this is not evidence about real players.

Three findings

Finding 1

Human-model information produced the largest incremental AUC gain.

Evidence
B → C: +0.047 ROC-AUC, paired 95% CI +0.040 to +0.054 (AUC 0.826 → 0.873).
Interpretation
Maia-3's estimate of how plausible each move is for a similarly rated human carried information about these controlled substitutions that the engine aggregates did not.
Limitation
Controlled decision-level substitutions drawn from the same engine used for analysis; real assistance may look different. Compared against our approximation of the statistical framework, not Regan's calibrated model.
Finding 2

Stockfish aggregates added a smaller positive increment.

Evidence
A → B: +0.007 ROC-AUC, paired 95% CI +0.003 to +0.010 (AUC 0.820 → 0.826).
Interpretation
Re-using engine statistics in a more flexible model changed discrimination far less than adding the human-move features did.
Limitation
Our baseline is a simplified, Regan-inspired approximation; Regan's model may extract more from the same engine data.
Finding 3

Sequence features added another small positive increment.

Evidence
C → D: +0.007 ROC-AUC, paired 95% CI +0.002 to +0.011 (AUC 0.873 → 0.880).
Interpretation
When substitutions cluster in difficult moments, how accuracy varies across the game is informative beyond totals. Difficulty-aware analysis itself is not new: Regan's model accounts for difficulty and offers EWN weighting.
Limitation
Selective substitutions target our own learned difficulty measure, which the sequence features also use, so this is an optimistic setting.

At a strict false-alarm target

Expert detail

Each system's threshold was set on validation original games for a 1% false-alarm target, then applied once to the test set. The realized false-alarm rate on test differs by system.

Recall and realized test false-positive rate at a 1% validation target
SystemRecallRealized FPR
AStatistical baseline32.1%1.0%
B+ Stockfish aggregates37.1%1.7%
C+ Maia-340.9%1.0%
D+ Sequence features40.4%0.7%

Do not rank C and D by recall alone. C reached 40.9% recall at a realized FPR of 1.0%; D reached 40.4% at 0.7%. They operate at different false-alarm rates, so the comparison is not like-for-like. Realized FPR is measured on 605 original test player-games, so each false alarm moves it by 0.17%. Recall differences at this operating point were not significance-tested.

Why this may be worth investigating further

1 · Learned human prior

Maia-3 provides a modern learned estimate of what similarly rated humans tend to play.

2 · Complementary signal

The largest incremental gain in this benchmark appeared when the human-model signal was introduced.

3 · Next validation
The scientifically useful next step

The next scientifically useful experiment would be to evaluate whether these learned features add information when combined with Professor Regan's actual reference/calibration framework.

For experts
Full experimental evidence
All paired differences, the full metric table (incl. z-only A0, PR-AUC, Brier, RMSE), ROC curves, strategy × level and Elo-band results, baseline calibration and tails, regression, SHAP, exploratory pseudo-events, further findings, and downloadable figures and CSV.
Player-disjoint split, variants created after splitting

Dataset

Units are nested, not independent: each source game gives up to two player-games (one per colour), and each player-game gives one original row plus 15 substituted variants. All intervals therefore resample whole source games.
Sample sizes per split
SplitSource gamesOriginal player-gamesInjected variantsRows incl. originals
train9431,78826,82028,608
validation2975678,5059,072
test3216059,0759,680

Mean eligible decisions per player-game: 21.3. Original player-games are presumed human with no assistance injected by us; that they contain no real assistance is not established. · Substitution levels 0%, 5%, 10%, 20%, 40%, 70% · strategies Random, Selective, Subtle · test player-games by Elo band: 1000-1399: 131, 1400-1799: 145, 1800-2199: 202, 2200-2699: 127 · analysis: Stockfish 19 depth 12, MultiPV 5; Maia3 5M.

Test split · original vs substituted variants

Ablation: what each layer adds

All metrics use balanced class weights. TPR thresholds are chosen on validation original games for the target false-positive rate; the realized test FPR is shown beneath each TPR and differs by system. ROC-AUC intervals are 95% cluster-bootstrap intervals resampling source games.
Full ablation metrics on the held-out test split
ModelFeaturesROC-AUC95% CIPR-AUCTPR @ 1% targetTPR @ 5% targetBrierIntensity MAEIntensity RMSE
A0z(top-1) statistic only
no training on labels
10.785—0.818
31.5%
test FPR 1.2%
43.9%
test FPR 6.1%
———
AStatistical baseline
LogisticRegression / Ridge
100.820[0.812, 0.829]0.846
32.1%
test FPR 1.0%
49.9%
test FPR 6.0%
0.17110.9 pp14.0 pp
BStockfish-XGB
XGBoost
190.826[0.819, 0.833]0.855
37.1%
test FPR 1.7%
52.0%
test FPR 5.8%
0.1669.1 pp12.4 pp
CStockfish+Maia-XGB
XGBoost
300.873[0.864, 0.882]0.892
40.9%
test FPR 1.0%
55.7%
test FPR 4.0%
0.1426.9 pp9.6 pp
DStockfish+Maia+Sequence-XGB
XGBoost
440.880[0.873, 0.887]0.898
40.4%
test FPR 0.7%
57.6%
test FPR 3.6%
0.1386.9 pp9.5 pp

Bold marks the best value in ROC-AUC, PR-AUC, Brier and the intensity errors (in percentage points). TPR columns are not ranked: each system's validation-set threshold produced a different realized test FPR, so recall alone does not order them (D's lower recall than C's at the 1% target comes with a lower realized FPR). A0 is a single z-statistic, so it has no Brier score or regressor (—). Brier is computed on scores that are similarity measures, not probabilities of cheating.

Numerical change and paired evidence, reported separately

Incremental value of each layer

Paired source-game cluster bootstrap on the saved held-out predictions (2,000 resamples of 321 test source games; the same resample is used for both systems). Post hoc: no model was refitted and nothing was tuned on test data. 7 comparisons without multiplicity correction; the intervals cover resampling of test games, not variation from refitting the models.
Paired differences in ROC-AUC
A0 → A
+0.035 [+0.029, +0.041]
A → B
+0.007 [+0.003, +0.010]
B → C
+0.047 [+0.040, +0.054]
C → D
+0.007 [+0.002, +0.011]
A → C
+0.053 [+0.046, +0.061]
A → D
+0.060 [+0.052, +0.068]
B → D
+0.054 [+0.045, +0.061]
Δ ROC-AUC
00.020.040.06
paired 95% CI
Paired bootstrap differences in ROC-AUC
ComparisonDifference95% intervalShare of resamples ≤ 0
Baseline z(top-1) only to Statistical baseline0.03500.0291 to 0.04050.00%
Statistical baseline to Stockfish-XGB0.00660.0026 to 0.01050.10%
Stockfish-XGB to Stockfish+Maia-XGB0.04680.0395 to 0.05360.00%
Stockfish+Maia-XGB to Stockfish+Maia+Sequence-XGB0.00670.0025 to 0.01100.10%
Statistical baseline to Stockfish+Maia-XGB0.05340.0458 to 0.06070.00%
Statistical baseline to Stockfish+Maia+Sequence-XGB0.06010.0516 to 0.06810.00%
Stockfish-XGB to Stockfish+Maia+Sequence-XGB0.05350.0451 to 0.06120.00%
Each system's own ROC-AUC and 95% interval
A0z(top-1) statistic only
0.785
AStatistical baseline
0.820
+0.035
BStockfish-XGB
0.826
+0.007
CStockfish+Maia-XGB
0.873
+0.047
DStockfish+Maia+Sequence-XGB
0.880
+0.007
ROC-AUC, 95% CI
0.760.780.800.820.840.860.880.90
Δ step
For reference. Overlap of these individual intervals is a visual comparison: it does not show “no gain”, and non-overlap is not a paired test.
  1. 01Fitting a linear model on all aggregate statistics (A) instead of z(top-1) alone (A0) changed ROC-AUC by +0.035 (0.785 → 0.820). Paired 95% interval +0.029 to +0.041: excludes 0.
  2. 02Adding nonlinear Stockfish aggregates with gradient boosting (B) changed ROC-AUC by +0.007 (0.820 → 0.826). Paired 95% interval +0.003 to +0.010: excludes 0. (Individual intervals overlap — a visual comparison only.)
  3. 03Adding Maia-3 human-move features (C) changed ROC-AUC by +0.047 (0.826 → 0.873). Paired 95% interval +0.040 to +0.054: excludes 0. (Individual intervals do not overlap — a visual comparison only.)
  4. 04Adding sequence and criticality features (D) changed ROC-AUC by +0.007 (0.873 → 0.880). Paired 95% interval +0.002 to +0.011: excludes 0. (Individual intervals overlap — a visual comparison only.)
Generated from the measured results

Further findings

Provenance: Experimental finding. Measured on the held-out test split of our controlled decision-level substitution benchmark.

The human-model gain was largest for Subtle substitutions.

Evidence
Mean ROC-AUC change over the five levels: Random +0.038, Selective +0.018, Subtle +0.084. Largest single change: Subtle 20% (0.677 → 0.819).
Interpretation
Subtle substitutes are often not the engine's first choice, so engine-match counts change little; a plausible explanation is that Maia-3 assigns these substitutes lower predicted probability than the moves players of that rating usually choose.
Limitation
Each condition compares 605 original with 605 substituted test player-games; differences between conditions are noisy and not significance-tested.

Engine-based statistics alone already separate heavy, obvious substitution.

Evidence
Statistical baseline ROC-AUC for Random substitution: 0.982 at 40% and 0.999 at 70%.
Interpretation
The open question is low-level, selective or subtle assistance — which is where the additions are tested.
Limitation
Detectability of obvious substitution is inflated because substitutes come from the analysis engine itself.

The human-model gain was smallest in the 2200-2699 band.

Evidence
ROC-AUC change from adding Maia-3, by Elo band: 1000-1399 +0.049, 1400-1799 +0.048, 1800-2199 +0.052, 2200-2699 +0.036 (largest: 1800-2199).
Interpretation
The change is numerically positive in every band; its size varies.
Limitation
Per-band test samples are small (1800-2199: 202, 1400-1799: 145, 1000-1399: 131, 2200-2699: 127 original player-games); band differences were not tested.

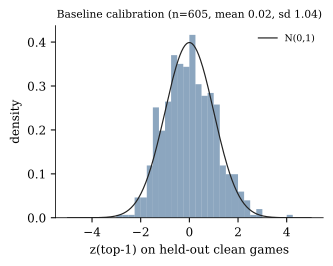
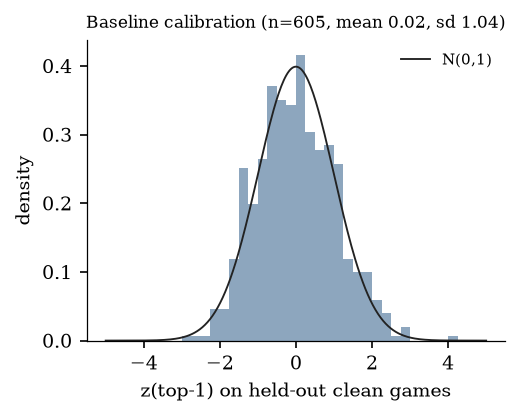
The baseline z-scores are centred with near-unit spread on original test games; their tails are not validated.

Evidence
On 605 original test player-games, z(top-1) has mean 0.02 and SD 1.04; 3.3% exceed z = 2 (N(0,1): 2.3%). In the upper tail, z(top-1, hard positions) exceeds 3 for 0.99% of games (6 of 605) versus 0.14% under N(0,1).
Interpretation
Mean near 0 and SD near 1 hold by construction of κ and do not establish normal tails. A heavier tail means a fixed z threshold would flag more original games than nominal.
Limitation
Tail shares rest on a handful of games out of 605; calibration is relative to our projection model and Lichess rapid games, not Regan's reference data.

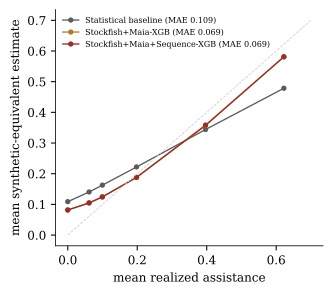
Assistance-intensity estimates became more accurate with the additions.

Evidence
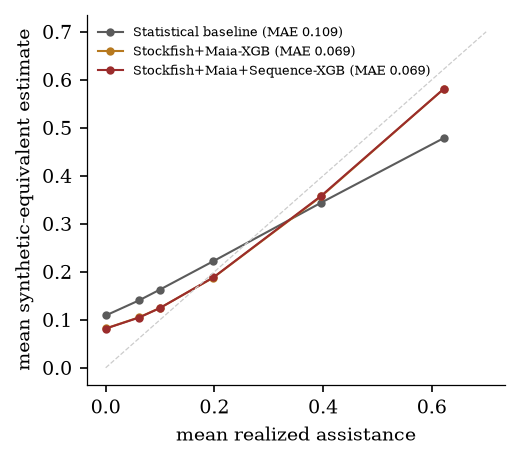
Mean absolute error of the synthetic-equivalent assistance estimate: 10.9 pp (statistical baseline) → 6.9 pp (full model). On original games (0% substituted) the full model's mean estimate is 8.2%.
Interpretation
The estimate summarizes how closely a game resembles the controlled variants — it is not a probability that a player cheated, and it is biased upward near 0% because it cannot go below zero.
Limitation
Evaluated on 605 original test player-games and their substituted variants; only meaningful for patterns resembling the three synthetic strategies. MAE differences were not significance-tested.
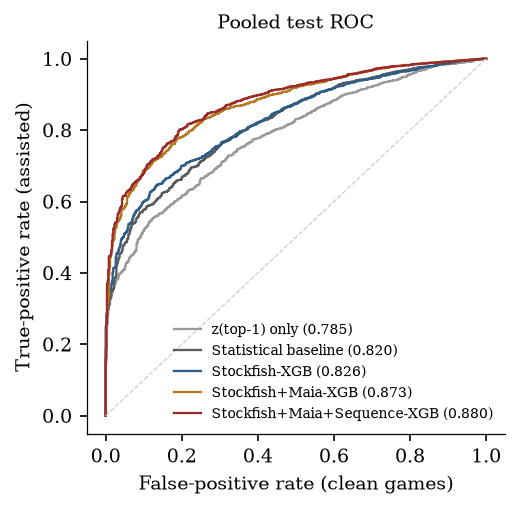
Pooled test split

ROC curves

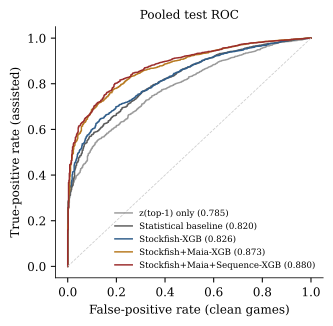
Pooled ROC curves (test split)
A0 · z(top-1) only (0.785)A · Statistical baseline (0.820)B · Stockfish-XGB (0.826)C · Stockfish+Maia-XGB (0.873)D · Stockfish+Maia+Sequence-XGB (0.880)Chance
All test variants pooled (every strategy and level against original player-games), with balanced class weights. Legend values are each model's test ROC-AUC. The dashed diagonal is chance.
Strategy, level and rating

Where the models differ

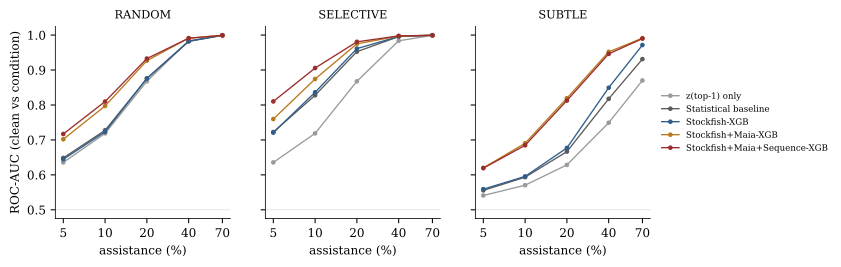
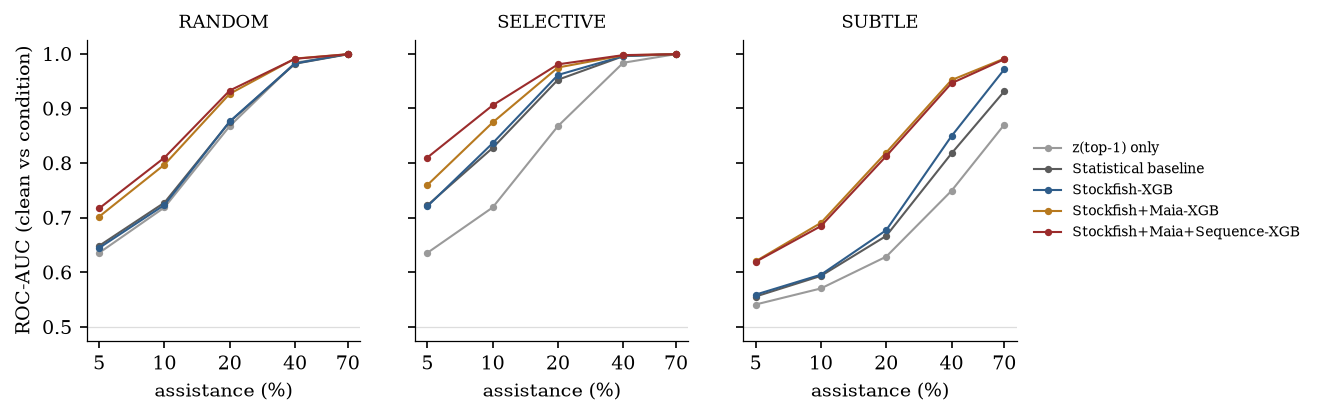
ROC-AUC by assistance level, per strategy
A0 · z(top-1) statistic onlyA · Statistical baselineB · Stockfish-XGBC · Stockfish+Maia-XGBD · Stockfish+Maia+Sequence-XGB
Random
Selective
Subtle
Each point compares original test player-games with their substituted variants at one nominal level. In this export z(top-1) alone (A0) has identical ROC-AUC for Random and Selective at every level: it counts top-1 matches but not where they occur, so it cannot see that Selective concentrates substitutions in hard positions.
ROC-AUC by Elo band
A · Statistical baselineB · Stockfish-XGBC · Stockfish+Maia-XGBD · Stockfish+Maia+Sequence-XGB
Band labels show the number of test player-games.
Score distributions: original vs substituted
Original (0%)Substituted (10%)
Share of test player-game variants per score bin (all strategies pooled at the selected level). Overlap is where original and substituted games are indistinguishable.
Held-out original test player-games

How do the baseline z-scores behave on original games?

κ is chosen so that z has unit variance on validation original games, so a mean near 0 and SD near 1 are expected by construction. The tails are the informative part, and with this sample they rest on a few games.
Original test games: distribution of z(top-1, hard positions)
Original test games (density)N(0,1)
Bars: empirical density of the statistic on held-out original player-games. Line: standard normal density N(0,1). A similar centre and spread do not show that the tails match.
Centre, spread and tails on original test games
Upper tail heavier than N(0,1): z(top-1, hard positions) exceeds 3 in 0.99% of games (6 of 605) vs 0.14% expected.
StatisticnMeanSDz > 2 (normal)z > 3 (normal)
z(top-1 match)6050.021.043.3% (2.3%)0.17% (0.14%)
z(top-3 match)6050.020.972.1% (2.3%)0.00% (0.14%)
z(move loss)6050.001.072.5% (2.3%)0.17% (0.14%)
z(top-1, hard positions)6050.040.993.6% (2.3%)0.99% (0.14%)
z(human surprisal)6050.050.882.3% (2.3%)0.33% (0.14%)
Under N(0,1): mean 0, SD 1 and the bracketed tail shares. Mean ≈ 0 and SD ≈ 1 follow largely from how κ is estimated; a heavier observed tail means a fixed z threshold flags original games more often than nominal. Tail shares here rest on a few games each.
Classifier and regressor

Calibration and assistance estimates

Calibration (test split, balanced weights)
A · Statistical baselineB · Stockfish-XGBC · Stockfish+Maia-XGBD · Stockfish+Maia+Sequence-XGBPerfect calibration
Mean predicted score vs observed share of substituted variants per score decile (balanced weights). The diagonal is perfect calibration on this benchmark only. Scores remain similarity measures for controlled substitution, not probabilities of cheating.
Synthetic-equivalent estimate vs realized substituted fraction
A · Statistical baselineB · Stockfish-XGBC · Stockfish+Maia-XGBD · Stockfish+Maia+Sequence-XGBEstimate = truth
Mean regressor estimate against the mean realized substituted fraction at each nominal level (test split). Points below the diagonal at high levels are under-estimates; at 0% the estimate cannot go below zero, so original games receive a positive mean estimate.
Game-level SHAP

What the models rely on

Global feature importance (mean |SHAP|), top 15
A · aggregate statisticsB · Stockfish aggregatesC · Maia-3 human modelD · sequence / criticality
  • engine-best choices where Maia-3's most probable move differs0.674
  • rate of engine-best, hard, low-Maia-probability moves0.620
  • top-1 match in hard positions relative to projection (z)0.299
  • top-3 engine match relative to projection (z)0.221
  • top-1 engine match relative to projection (z)0.213
  • count of engine-best, hard, low-Maia-probability moves0.172
  • mean human surprisal (Maia-3)0.087
  • top-1 engine match rate0.081
  • human-model surprisal relative to projection (z)0.081
  • share of moves with Maia-3 predicted probability < 5%0.079
  • share of near-optimal moves (<= 25 cp)0.067
  • log-probability relative to Maia-3's most probable move0.063
  • top-3 engine match rate0.060
  • correlation of difficulty with engine agreement0.060
  • top-1 accuracy in hard positions0.051
Mean absolute SHAP value on the test split for the full model (D), classification score. Bar color marks the nested feature group in which each feature first enters.
Pseudo-events · not a longitudinal result

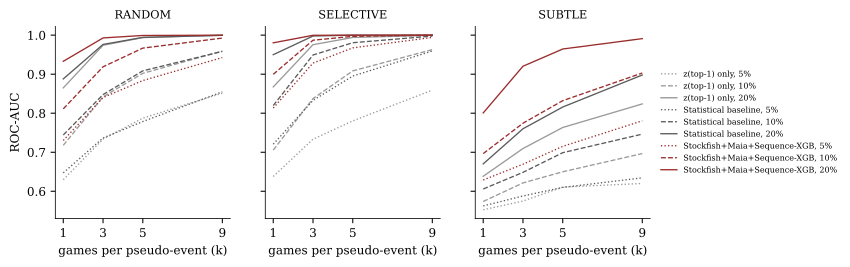
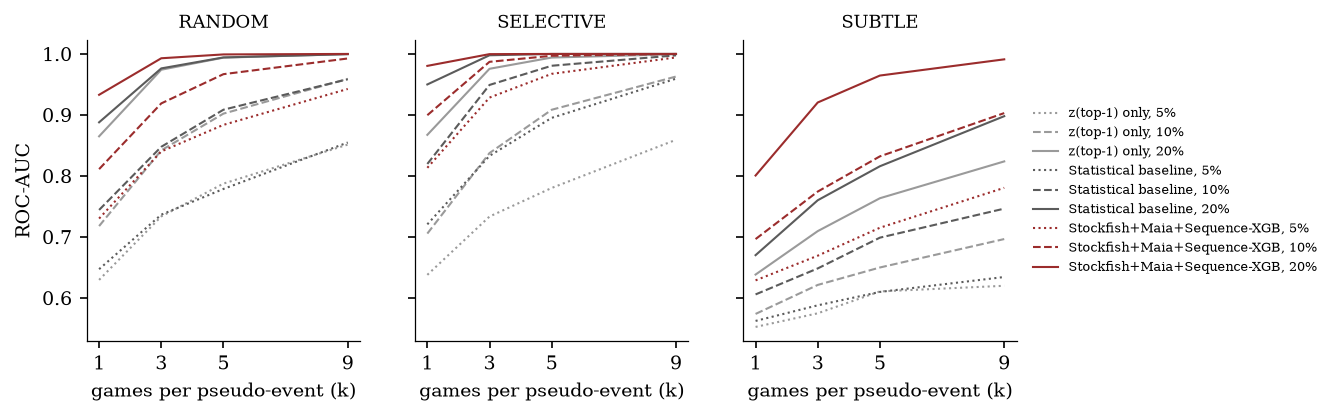
Exploratory pooling of different-player games

Result

Selective 5%: full model ROC-AUC 0.813 for one game → 0.994 for nine pooled games; statistical baseline 0.721 → 0.959.

Averaging scores over more games separates the two conditions better, as expected when per-game evidence is weak.

Limitation

Each pseudo-event pools k games by k DIFFERENT players of one Elo band (every player has one game here), all original or all substituted at the same strategy and level. This does not validate longitudinal detection for a single player, whose games are not independent draws and whose assistance would not be uniform. Regan notes the same caveat for “Frankenstein player” resampling.

Pseudo-events: ROC-AUC when k different-player games are pooled
A0 · z(top-1) statistic onlyA · Statistical baselineD · Stockfish+Maia+Sequence-XGB
Random
Selective
Subtle
k = number of games pooled
Each pseudo-event pools k test player-games by k different players of one Elo band, all original or all substituted with the same strategy and level; the event score is the mean per-game score. Exploratory only: this does not validate longitudinal detection for a single player.
Downloads

Figures and data for further research

Static figures rendered by the research pipeline from the same test-set predictions, and the exported data files this site reads.
  • All exported metrics (metrics.json)JSON
  • Provenance record: file hashes, split counts, consistency checks (provenance.json)JSON
  • ROC curve points (roc_curves.json)JSON
  • Pooled test ROC curvesSVGPNG
  • ROC-AUC by substitution level, per strategySVGPNG
  • Exploratory pseudo-event pooling of different-player gamesSVGPNG
  • Distribution of the Regan-inspired z(top-1) on original test gamesSVGPNG
  • Assistance estimate vs realized substituted fraction, by levelSVGPNG
Used for per-move explanations

Decision-level explanation model

A separate XGBoost classifier, trained on single decisions (label: was this decision substituted?), scores individual moves for resemblance to a synthetic substitution. It is used only to rank and explain moves. Game-level scores do not depend on it, and its per-move SHAP values are not a decomposition of the game-level classifier.
Test ROC-AUC
0.926
Test PR-AUC
0.808
positive rate 25.6%
ROC-AUC by strategy
Random0.921
Selective0.950
Subtle0.915
Training levels
0%, 20%, 40%
14 per-decision features

Independent Prototype

MoveLens was developed from publicly available research, documentation, open-source chess engines, released models and independently constructed experiments. It does not use Professor Regan's private reference files, adjudication records or proprietary calibrations.

The purpose of the prototype is to determine which modern AI signals may be worth validating against the full reference framework.